This is the narrative to go with the circuit diagrams of my Frequency Meter. I'm going to be wordy in some places and brief in others, according to my own taste. I assume you know something about digital circuitry, so I won't have to explain the basic concepts.
There are schematic diagrams and photographs that go with the text. They
are represented by thumbnail images. If you click on the thumbnail, the
full-size image will open in a new window, so you can view both the image
and the text that goes with it.
A note about the components: I used standard 74LS logic, except where otherwise marked. (Note that the LED drivers are the higher-power 7406, not the 74LS06.) The transistors are generic PNP transistors; just about any PNP switching device will do. Other components:
The sensor components (both pressure and optical) were purchased from All Electronics (http://www.allelectronics.com), toll free order line 1-888-826-5432. That was in 1995. There are similar components that might serve as replacements in the current catalog.
2-input gate 74LS00 3-input gate 74LS10 8-input gate 74LS30 Flip-flop (D-type) 74LS74 Demux (2-bit to 4-line) 74LS156 Inverters 74LS14 Counter (dual 4-stage) 74LS393 Register (6-bit) 74LS174 LED drivers 7406 (not LS) Voltage comparator LM339 7-segment LED display HP 5082-7730
You will definitely want to use a 1K trimpot to set the threshold. This must be adjusted when you change sensors, and may need adjustment from time to time as the sensors age. I made mine accessible through a narrow screwdriver hole in the front panel. It can't be tweaked inadvertently, but you can adjust it without opening the case.
The adjustment is facilitated by two LEDs, visible on the front panel. They are called the "wave indicators" on the Control Section schematic. One or the other is always on, depending on whether the wave-shaper is on or off. They show graphically the state of the wave-shaper. With the pressure transducer, the LEDs are also used to adjust the clamp pressure.
Either sensor assembly can be connected to the chassis via a 4-pin connector:
| Normal Refresh (2-3 per sec) |
Slow Refresh (1 per sec) |
|
| Pressure sensor (or other sensor giving one pulse per cycle) |
A "on" | A & B "on" |
| Optical sensor (or other sensor giving two pulses per cycle) |
B "on" | B & C "on" |
The most significant ten bits are used as readout. This allows frequencies as low as 114 cpm to be measured. It also allows display of higher frequencies than 350, but the resolution on frequencies above 350 will be more than one cpm.
This allocation of counter sections was designed using a computer program described in the appendix.
The counter is a straight binary counter, except for two interesting variations:
The 2732 PROM has its 32K bits arranged as 4096 bytes of 8 bits each. We use most of it, arranging it as:
|
Pinouts |
Pinouts |
Pinouts |
|
|
|
|
|
|
|
|
|
|
|
|
|
|
|
|
|
|
|
|
|
|
|
|
|
|
|
|
|
|
|
|
|
|
|
|
|
|
|
|
|
|
|
|
|
|
|
|
|
|
|
|
|
|
|
|
|
|
|
|
|
|
|
|
|
|
|
|
|
|
|
|
|
|
|
|
|
|
|
|
|
|
|
|
|
|
|
|
|
|
|
|
|
|
|
|
|
|
|
|
|
|
|
|
|
|
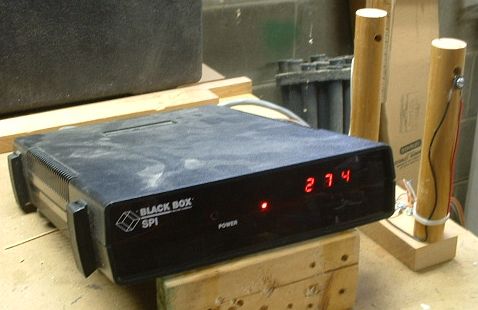 The electronics is built into a plastic case originally intended
for telecommunications equipment. The box has snap locks on the side for
full top access to the circuitry. The front panel is dark red transparent
plexiglass, so the red LED displays can be seen but the circuitry cannot.
The front panel has small holes for access to the trim adjustments of the
input threshold and hysteresis.
The electronics is built into a plastic case originally intended
for telecommunications equipment. The box has snap locks on the side for
full top access to the circuitry. The front panel is dark red transparent
plexiglass, so the red LED displays can be seen but the circuitry cannot.
The front panel has small holes for access to the trim adjustments of the
input threshold and hysteresis.The back of the case has a large open area for cables and connectors. |
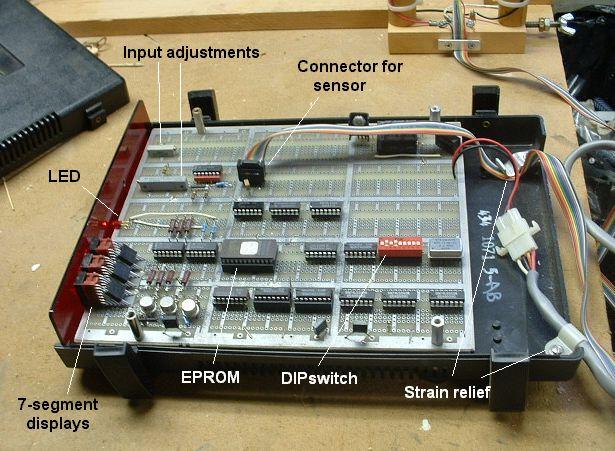 The next photo shows the electronics with the top shell
removed from the case. The circuit is built on a prototyping board; I did
not make a printed-circuit board. All the ICs are socketed, and the sockets
have long wire-wrap leads.
The next photo shows the electronics with the top shell
removed from the case. The circuit is built on a prototyping board; I did
not make a printed-circuit board. All the ICs are socketed, and the sockets
have long wire-wrap leads.The 7-segment LED displays are mounted in right-angle sockets, so the are against the transparent red front of the case. The "wave indicator" LEDs are also against the front panel; one is mounted on the top of the circuit board and the other (not visible in the photo) is in the same position on the bottom of the board. The controls for adjusting the input threshold and hysteresis are multi-turn potientiometers. They are mounted near the front panel, with the screw adjustment facing the panel. There is a small hole in the panel in front of each. With some manual dexterity, it is possible to use a small screwdriver to adjust them without opening the case. The cable to the sensor is a flat "rainbow" ribbon cable, which connects to the circuit board via a pin plug. Each sensor has its own cable and plug, so they can be interchanged. A clamp at the open back of the case provides strain relief for the connector and circuit board. To change the sensor, you must:
|
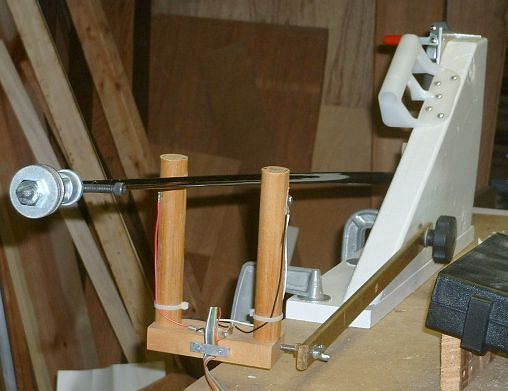
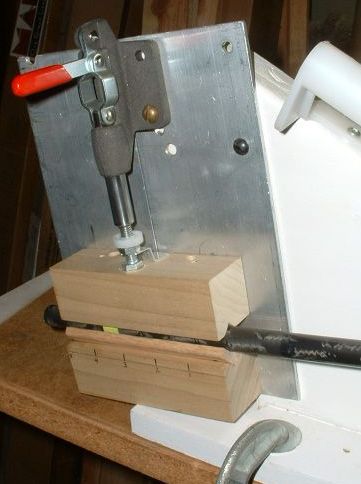
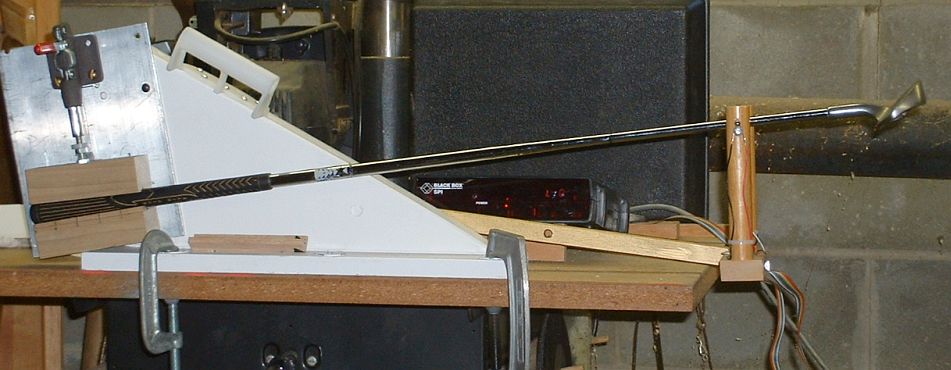 The first picture is an overview of the whole frequency
meter, consisting of the clamp for the club (which itself is C-clamped
to the workbench), the yoke containing the infrared source and detector,
and the electronics. A club (with a grip) is clamped for measurement. The
clamp will also accommodate an ungripped shaft, as we shall see below.
The first picture is an overview of the whole frequency
meter, consisting of the clamp for the club (which itself is C-clamped
to the workbench), the yoke containing the infrared source and detector,
and the electronics. A club (with a grip) is clamped for measurement. The
clamp will also accommodate an ungripped shaft, as we shall see below.The clamp is cocked up at a 12-degree angle. That is flat enough so that the club is vibrating essentially up and down when considering rigidity issues, but the tip is still high enough to break the infrared beam to take a reading. |
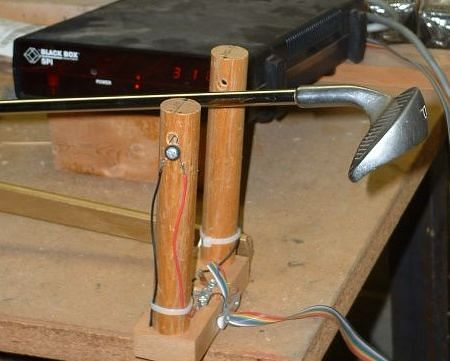 The optical sensor is a U-shaped yoke made of two 1" dowels
(sections of broomstick, actually) screwed to a length of 1x2 lumber. The
infrared LED (emitter) is in a hole near the tip of one dowel, and the infrared
detector is similarly located in the other dowel. I deliberately left a
lot of space for the shaft tip to vibrate and even to "oval". There is almost
3" between the dowels and 5" from the bottom to the LED holes.
The optical sensor is a U-shaped yoke made of two 1" dowels
(sections of broomstick, actually) screwed to a length of 1x2 lumber. The
infrared LED (emitter) is in a hole near the tip of one dowel, and the infrared
detector is similarly located in the other dowel. I deliberately left a
lot of space for the shaft tip to vibrate and even to "oval". There is almost
3" between the dowels and 5" from the bottom to the LED holes.The holes for the infrared components were drilled before the yoke was screwed together. They were drilled as one in a drill press, with both dowels clamped together for alignment. While still clamped, a pair or arrows were drawn on the ends of the dowels with a single ruler and single swipe of the pen (a sharp-pointed permanent marker). These arrows helped with alignment at assembly, as did sighting through the holes. The wires from the infrared components are led down the dowels to screw terminals in the base, where they are attached to the ribbon cable that goes to the electronics. |
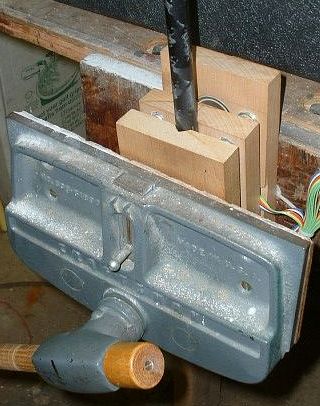
 This is an end view of the whole assembly. In this case, an
ugripped shaft is being measured with a 205-gram tip weight. We will see
shortly how we change the clamp from grip mode to bare shaft.
This is an end view of the whole assembly. In this case, an
ugripped shaft is being measured with a 205-gram tip weight. We will see
shortly how we change the clamp from grip mode to bare shaft.The yoke is attached to the main base unit by an arm that is secured by a single bolt. A large threaded knob is the "nut" for that bolt; it is readily loosened and tightened by hand. Therefore, it is easy to adjust the angle of the arm so that the shaft sits in the middle of the beam when at rest. That gives the most stable and accurate reading when the shaft is plucked. In actual use, this adjustment only needs to be changed when switching between gripped and ungripped shafts. The oddly-shaped white gadget screwed to the sloping edge of the base unit is a carrying handle. The offset of the handle has it better aligned with the center of gravity of the whole assembly than a straight handle would, so it hangs straight when you carry it. (In case you're wondering, the offset handle was part of the packing that came with a Pella patio door.) |
 The clamp itself is a pair of hardwood jaws, fashioned from
2x2 lumber (actually 1.5"x1.5", of course) cut to length for the standard
5" clamp. The lower jaw is fixed, and the upper jaw is driven by a toggle
clamp. (A DeStaco toggle clamp. I think it was model 603 but I'm not sure.)
The clamp itself is a pair of hardwood jaws, fashioned from
2x2 lumber (actually 1.5"x1.5", of course) cut to length for the standard
5" clamp. The lower jaw is fixed, and the upper jaw is driven by a toggle
clamp. (A DeStaco toggle clamp. I think it was model 603 but I'm not sure.)The clamp is attached to a 7"-wide aluminum plate made from two aluminum angles, each 3.5" by 1.25" and 1/8" thick. When they are bolted together at the 1.25" flange, they form a plate that is very rigid in the direction of the toggle throw, which is the direction of the load on the plate. This plate is secured to the wooden base by large wood screws, most through the 1.25" flange and a couple through the 3.5" face. The whole assembly is very strong and rigid. The vertical and horizontal members of the base unit are fastened together with 4 large wood screws and shafting epoxy -- again very strong and rigid. There are three steel washers epoxied to the horizontal member; they are used as pads to C-clamp the assembly to a tabletop as shown. The holes in the washers are drilled down through the wood, so the washers can also serve as pads to bolt the assembly more permanently to the workbench. The club shown in the clamp has a grip on the end of the shaft. The next few images will include details of the clamp, including how we switch it to handle an ungripped shaft butt. A key piece of the switch is the 5" length of hardwood angle sitting on the horizontal portion of the base. It has "pins" that sit loosely in holes in the base; that is just a storage position for it. |
 Here is a closeup of the clamp, with no shaft chucked in it.
The lower jaw is screwed to the plate. It has a V-groove routed in it for the shaft. The groove is the same distance from the plate as the centerline of the toggle clamp's shaft. That keeps the clamp's force squarely on the shaft. The groove is 1/2" wide by 1/4" deep. There are two hexagonal aluminum posts mounted to the lower clamp. (Round posts would have been just as good, but I had the hex posts on hand in the right size.) The upper jaw has clearance holes for the posts, and rides up and down on them. The clearance holes are sufficiently loose that the angle of the upper jaw can change to accommodate a no-taper shaft butt or a tapered grip. The upper jaw has a V-groove that mates with the groove in the lower jaw. Together, they hold the shaft rigidly. The toggle clamp drives the upper jaw. Its 5/16" screw meets the jaw in a shallow, wide hole that keeps it from sliding around. (Analysis shows that this hole is superfluous, but just to be on the safe side it's there anyway.) There is a plastic wheel affixed to the screw, used to adjust the final position of the clamp; it is essentially a clamp pressure adjustment. When the toggle clamp is released and lifted, a small metal fitting on the upper jaw engages the head of the screw and causes the upper jaw to be lifted with it. I added calibration marks to the lower jaw at 1" intervals, to allow clamping shorter lengths than 5". However, since the toggle clamp presses in the middle of the 5" span, it is not clear how effective a shorter clamp would be. This has not been tested. |
 In this picture, I have taken the hardwood angle from its
storage position on the base. I am in the process of dropping it into the
V-groove in the lower clamp jaw. The pins drop into mating holes in the
bottom of the groove, and hold it in position. It is the bare-shaft fitting.
In this picture, I have taken the hardwood angle from its
storage position on the base. I am in the process of dropping it into the
V-groove in the lower clamp jaw. The pins drop into mating holes in the
bottom of the groove, and hold it in position. It is the bare-shaft fitting.Luckily, quarter-inch-thick angle is exactly the dimension to compensate for the difference between a gripped and ungripped shaft. It compensates for both the diameter and texture (the V-grooves dig into a grip just enough to give proper pressure). This, of course, assumes "normal" conditions: a .580"-.600" butt and a normal-size men's grip. For other switches, you may need to adjust the screw's depth wheel. |
 Now the ungripped shaft can be clamped for measurement. The
wheel can be used to change the pressure if necessary, but it seldom is
when the clamp is set properly.
Now the ungripped shaft can be clamped for measurement. The
wheel can be used to change the pressure if necessary, but it seldom is
when the clamp is set properly. |
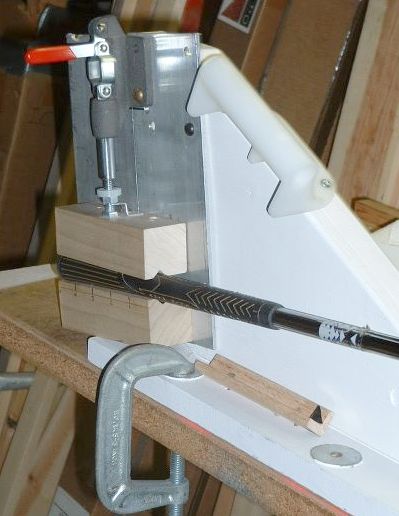
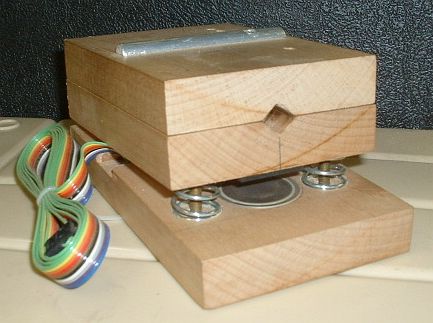
 One feature of this frequency meter is that it can use either
an optical sensor (described above) or a piezoelectric pressure transducer.
The transducer is mounted in the clamp, in such a way that pressure is applied
and released as the shaft vibrates.
One feature of this frequency meter is that it can use either
an optical sensor (described above) or a piezoelectric pressure transducer.
The transducer is mounted in the clamp, in such a way that pressure is applied
and released as the shaft vibrates.This picture shows the pressure-sensing clamp in use. The entire assembly is driven by a woodworking vise attached to the workbench. I use it with the shaft vertical, but that is not a necessity. Choose the orientation for rigidity first, and then convenience. |
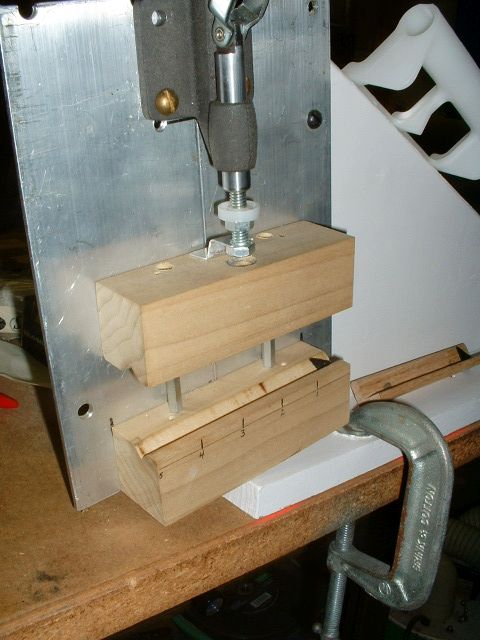
 The clamp consists of three pieces of hardwood coupled loosely
together.
The clamp consists of three pieces of hardwood coupled loosely
together.The two upper pieces are 5" long, and have matching V-grooves for the shaft. They are held together by wood screws which are only partway screwed in. For the rest of their length, they slide in the pilot hole, allowing the pieces to be separated (as shown) to insert or remove the shaft. The lower piece is a bit longer, and contains the transducer. It is fastened to the middle piece by a hinge at the "back" (the left side in the picture) and a couple of springs in the "front". The springs are 20-pound automotive springs. When the boards are almost touching, the pair of springs assure that a 35-pound force is being applied at the front of the clamp. If the force is applied uniformly on the top piece, then the same force must be applied at the hinge, so the total force on the top piece is 70 pounds. The shaft holds the two pieces apart, so the full 70 pounds is shaft clamping force. |
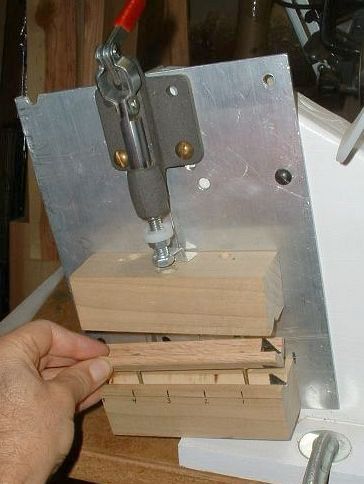
The view from the front shows the circular piezoelectric transducer fastened to the bottom piece. There is a smaller piece of fairly firm neoprene attached to the middle piece. When the springs are compressed enough, the neoprene presses on the transducer. The aluminum half-round on the top piece is exactly halfway between the springs and the hinge. It is the point against which the vise closes, so that is where the force is applied to the clamp. That guarantees equal forces in the hinge and the spring, so the clamping pressure is uniform over the 5" of the shaft that are clamped. The other function of the half-round is to allow a change of angle between the jaws if a gripped shaft is inserted in the V-groove. The bottom piece rests flat against one jaw of the vise. The top piece uses the half-round as a pivot or fulcrum, allowing the angle to adjust itself. The following steps are required to set up for measurement:
|
|
Stages |
Stages |
|
|
|
|
|
|
|
|
|
|
|
|
|
|
|
|
|
|
|
|
|
|
|
|
|
|
|
|
|
|
|
|
In trying to figure the range I had to have, I consulted the 1995 DSFI Shaft Fitting Addendum. The lowest frequency driver was 194 cpm (FiberSpeed FS-100), and the highest frequency 5-iron was 338 cpm (TT Dynamic X). The row that covered the entire range was the highlighted one, with 9 pre-stages and 10 post-stages, so I used it.
The sharp-eyed among you may have noticed that the circuit actually has
10 pre-stages, not 9. That's because the oscillator I was about
to get cheaply (well, free; it was in my basement) was a 2MHz clock, not
1MHz. So I used the extra pre-stage (it was on the chip anyway)
to count from 2MHz to 1MHz.
I also set it up so that:
Dave Tutelman
March 1995